Next: Linear Interpolation Methods-The Secant Up: Solving Nonlinear Equations Previous: Blackbody Radiation Contents
 .
.
 that bracket a root.
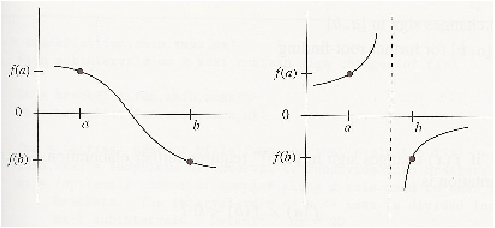
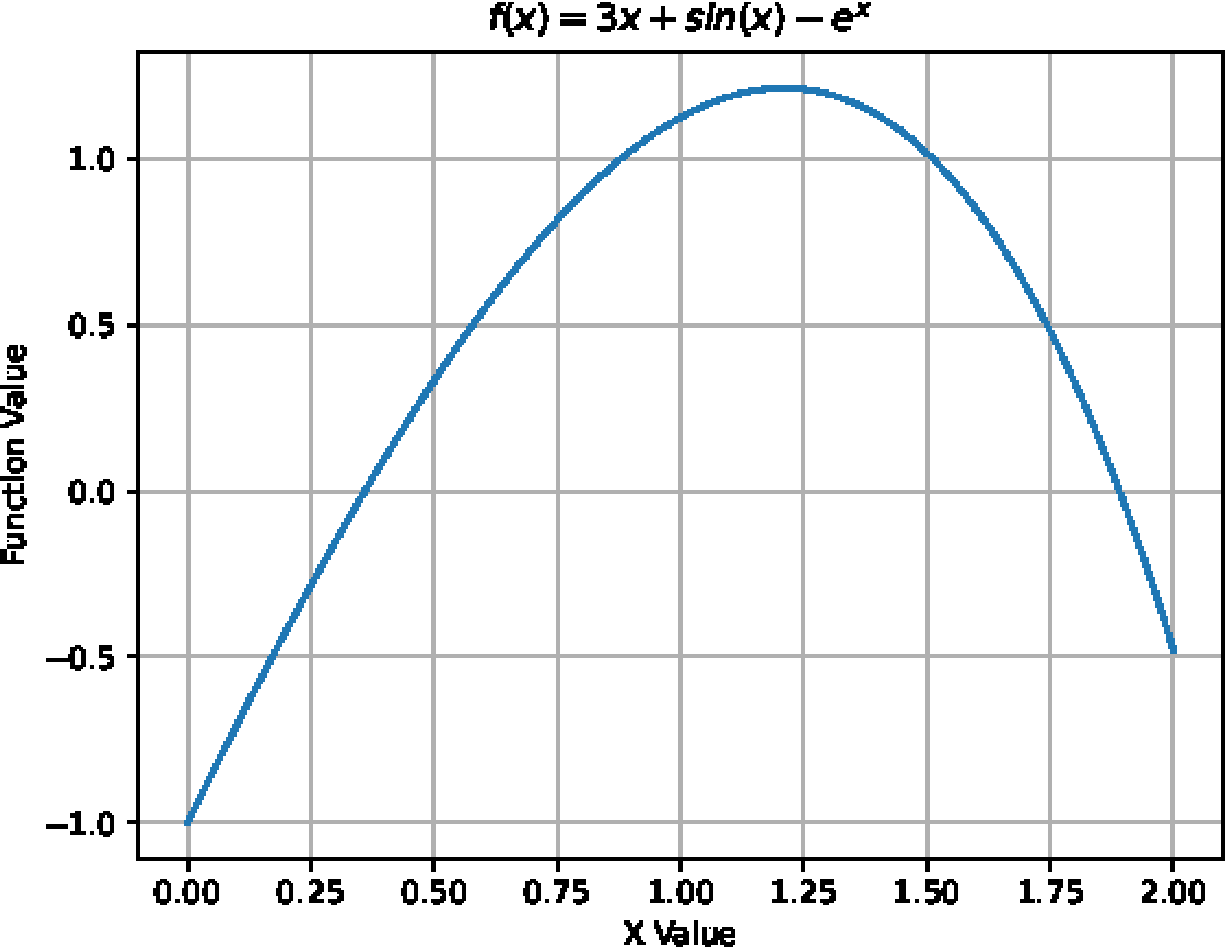
changes signs at these two x-values and, if is continuous, there must be at least one root between the values.
does change sign between points
that bracket a root.
changes signs at these two x-values and, if is continuous, there must be at least one root between the values.
does change sign between points  and
and  is to see if
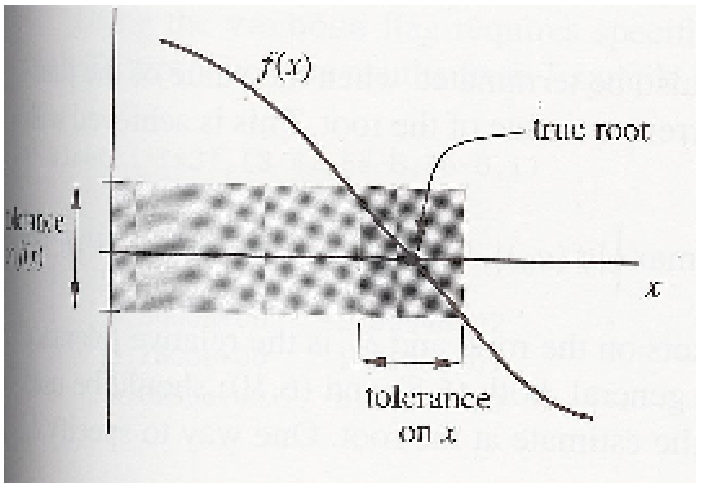
 (see Fig. ).
|
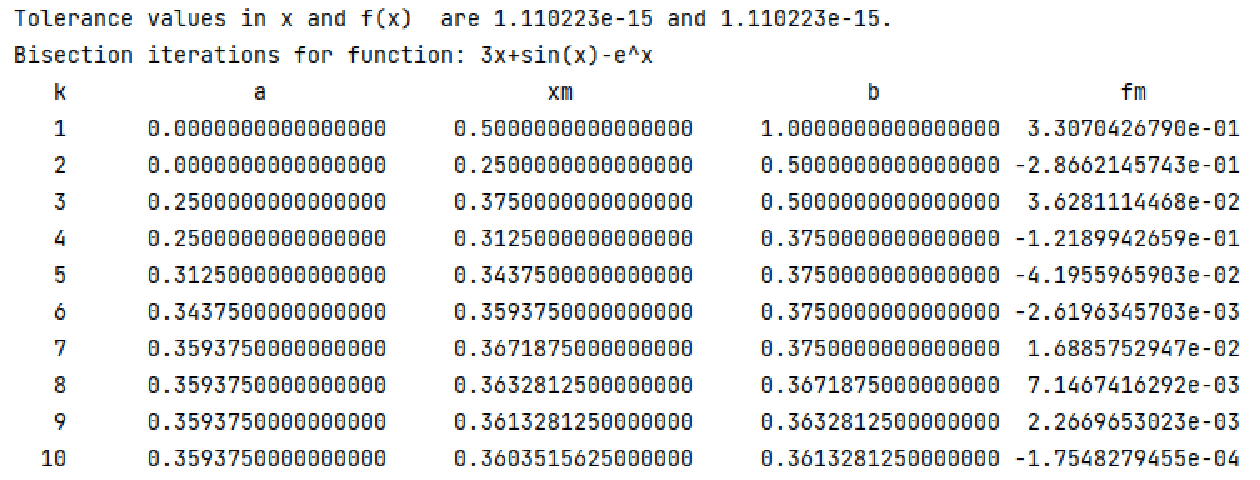
The bisection method then
|
is useful to know where to start.

|
|
 and
and  .
. (Example py-file:
mybisect.py)
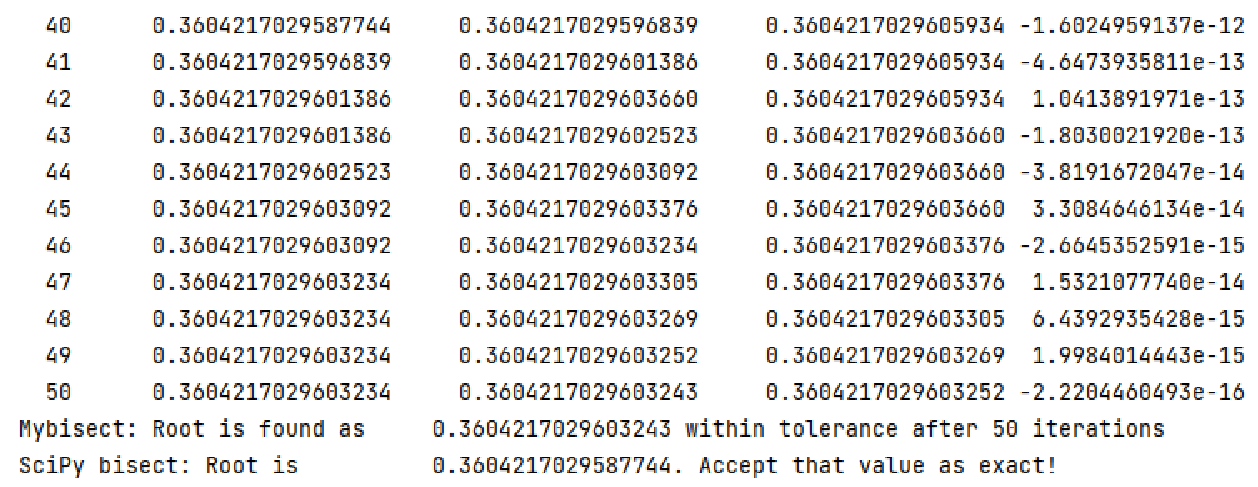
that makes exactly zero in floating-point arithmetic.
.
. (Example py-file:
mybisect.py)
that makes exactly zero in floating-point arithmetic.
|
|