- Suppose that a probability distribution of a random variable
 is specified.
- For a measure of central tendency of the random variable we use the terms expectation, expected value, and average value for the same concept.
- Intuitively, the expected value of is the average value that the random variable takes on.
- However, some of the values of the random variable could be more (or less) probable than the other in the distribution unless the random variable is distributed uniformly.
- Hence, in order to consider an average value of we need to take its probability into account.
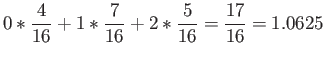
- Example: If two coins are tossed 16 times and is the number of heads that occur per toss, then the value of can be 0, 1, 2.
- The experiment yields no heads, one head, and two heads a total of 4, 7, and 5 times, respectively.
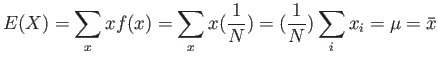
- The average number of heads per toss is then
where
 are relative frequencies
 |
0 |
1 |
2 |
 |
4/16 |
7/16 |
5/16 |
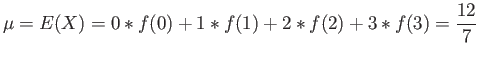
- Example 4.1: A lot contain 4 good components and 3 defective components.
- A sample of 3 is taken by a quality inspector.
- Find the expected value of the number of good components in this sample.
- Solution: represents the number of good components
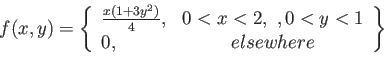
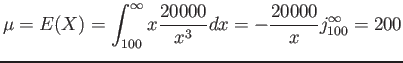
- Example 4.3: Let be the random variable that denotes the life in hours of a certain electronic device. The probability density function is as the following.
Find the expected life of this type of device.
- Solution:
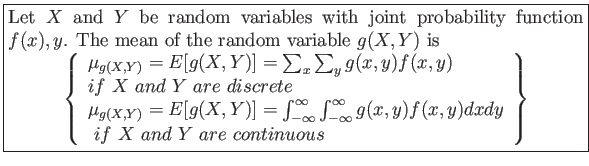
- Theorem 4.1::

- Example 4.5: Let be a random variable with density function
- Find the expected value of
 .
.
- Solution:
- Theorem 4.2::
- Example 4.7: Find
 for the density function
- Solution:
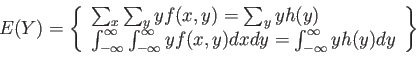
- If
 is
is
where  is the marginal distribution of
- If
 is
is
where  is the marginal distribution of
Cem Ozdogan
2012-02-15


![\begin{displaymath}
\begin{array}{l}
P[g(X) = 0] = P(X = 0) = f(0), \\
P[g(X) =...
...f(-1)+ f(1), \\
P[g(X) = 4] = P(X = 2) = f(2), \\
\end{array}\end{displaymath}](img418.png)
![\begin{displaymath}
\begin{array}{rl}
E(g(X))& = 0*f(0)+1*[f(-1)+f(1)]+4*f(2) \\...
...(0)+(1)^2*f(1)+(2)^2*f(2) \\
& = \sum_x g(x)*f(x)
\end{array}\end{displaymath}](img420.png)

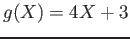
![$\displaystyle E[g(X)]=E(4X+3)=\frac{1}{3}\int_{-1}^2 (4x^3+3x^2)dx=8
$](img424.png)