Our sample space is the population of adults in a small town. They can be categorized according to employment status.
One individual is to be selected at random for a publicity tour.
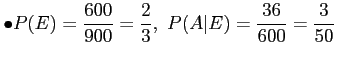
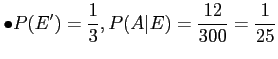
The concerned event : the one chosen is employed
Give the additional information that 36 of those employed and 12 of those unemployed are members of the Rotary Club.
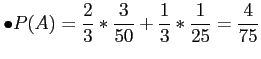
Find the probability of the event that individual selected is a member of the Rotary Club.
Figure 4:
Venn diagram for the events , , and .
Event is the union of the two mutually exclusive events and . Hence,
Figure 5:
Tree diagram for the data.
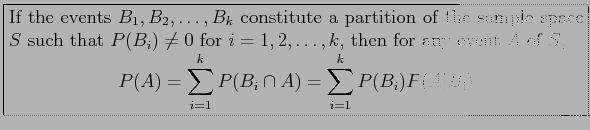
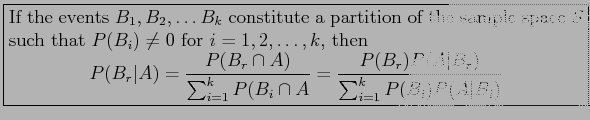
Theorem 2.16: (Theorem of total probability or rule of elimination)
Figure 6:
Partitioning the sample space S.
Example 2.41: In a certain assembly plant, three machines, , and make 30%, 45% and 25%, respectively, of the products.
It is known from past experience that 2%, 3%, and 2% of the products made by each machine, respectively, are defective.
Now, suppose that a finished product is randomly selected. What is the probability that it is defective?
Solution:
Event : the product is defective.
Event : the product is made by machine
Figure 7:
Tree diagram for Example 2.41.
Theorem 2.17: (Bayes'Rule)
It can be proved by the definition of conditional probability,
and then using Theorem 2.16 in the denominator.
Useful in problems where are not known but and are known.
Some terminology:
: priors
: likelihoods
: posteriors
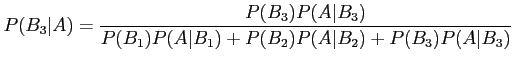
Example 2.42: With reference to Example 2.41, if a product were chosen randomly and found to be defective, what is the probability that it was made by machine
Using Bayes'rule,
Example 2.43: A manufacturing firm employs three analytical plans for the design and development of a particular product.
For cost reasons, all three are used at varying times. In fact, plans 1, 2, and 3 are used for 30%, 20%, and 50% of the products respectively.
The ``defect rate'' is different for the three procedures as follows:
where is the probability of a defective product, given plan .
If a random product was observed and found to be defective, which plan was most likely used and thus responsible?

![\includegraphics[scale=0.6]{figures/02-08}](img83.png)
![\includegraphics[scale=0.5]{figures/02-09}](img93.png)
![\includegraphics[scale=0.5]{figures/02-10}](img95.png)
![\includegraphics[scale=0.5]{figures/02-11}](img101.png)