Figure 5.5:
Resistance vs Temperature graph for the Least-Squares Approximation.
Until now, in this chapter we have assumed that the data are accurate, but when these values are derived from an experiment, there is some error in the measurements.
Some students are assigned to find the effect of temperature on the resistance of a metal wire. They have recorded the temperature and resistance values in a table and have plotted their findings, as seen in Fig. 5.5. The graph suggest a linear relationship.
values for the parameters, and , can be obtained from the plot.
If someone else were given the data and asked to draw the line, it is not likely that they would draw exactly the same line and they would get different values for and .
A way of fitting a line to experimental data that is to minimize the deviations of the points from the line. The usual method for doing this is called the least-squares method. The deviations are determined by the distances between the points and the line.
In analyzing the data, we will assume that the temperature values are accurate and that the errors are only in the resistance numbers; we then will use the vertical distances.
Figure 5.6:
Minimizing the deviations by making the sum a minimum.
We might first suppose we could minimize the deviations by making their sum a minimum, but this is not an adequate criterion. Consider the case of only two points (See Fig. 5.6). Obviously, the best line passes through each point, but any line that passes through the
midpoint of the segment connecting them has a sum of errors equal to zero.
We might accept the criterion that we make the magnitude of the maximum error a minimum (the so-called minimax criterion, but for the problem at hand this is rarely done.
The usual criterion is to minimize the sum of the squares of the errors, the least-squares principle.
In addition to giving a unique result for a given set of data, the least-squares method is also in accord with the maximum-likelihood principle of statistics. If the measurement errors have a so-called normal distribution and if the standard deviation is constant for all the data, the line determined by minimizing the sum of squares can be shown to have values of slope and intercept that have maximum likelihood of occurrence.
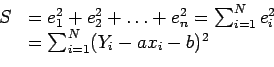
Let represent an experimental value, and let be a value from the equation
where is a particular value of the variable assumed to be free of error. We wish to determine the best values for and so that the 's predict the function values that correspond to -values. Let
. The least-squares criterion requires that
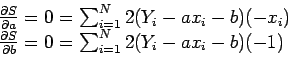
be a minimum. is the number of -pairs. We reach the minimum by proper choice of the parameters and , so they are the variables of the problem. At a minimum for , the two partial derivatives
and
will both be zero. Remembering that the and are data points unaffected by our choice our values for and , we have
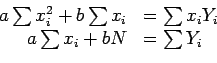
Dividing each of these equations by and expanding the summation, we get the so-called normal equations
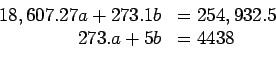
All the summations are from to . Solving these equations simultaneously gives the values for slope and intercept and .
MATLAB gets a least-squares polynomial with its polyfit command. When the numbers of points (the size of ) is greater than the degree plus one, the polynomial is the least squares fit.
![\includegraphics[scale=1]{figures/3.5.ps}](img692.png)
![\includegraphics[scale=1]{figures/3.6.ps}](img694.png)