- The
 -distribution finds enormous application in comparing sample variances.
- Theorem 8.6:
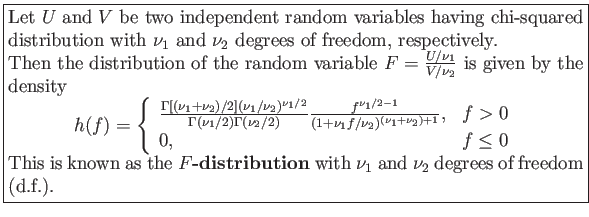
Figure 7.19:
Typical F-distributions.
|
|
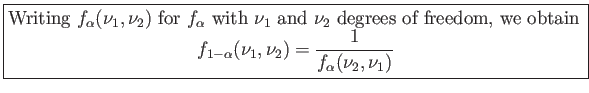
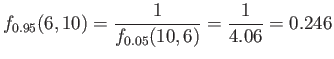
Figure 7.20:
Illustration of the
 for the -distribution.
|
|
- What is the -distribution used for?
- -distribution is called the variance ratio distribution.
- It is used two-sample situations to draw inferences about the population variances. (Theorem 8.8)
- It is also applied to many other types of problems in which the sample variances are involved.
- Suppose there are three types of paints to compare. We wish to determine if the population means are equivalent.
| |
Sample |
Sample |
Sample |
| Paint |
Mean |
Variance |
Size |
| A |
4.5 |
0.20 |
10 |
| B |
5.5 |
0.14 |
10 |
| C |
6.5 |
0.11 |
10 |
The notion of the important components of variability is best seen through some simple graphics.
Figure 7.21:
Data from three distinct samples.
|
|
Figure 7.22:
Data that easily could have come from the same population.
|
|
- Two key sources of variability:
- Variability within samples.
- Variability between samples.
- Clearly, if
 , the data could all have come from a common distribution.
- The above two sources of variability generate important ratios of sample variances, which are used in conjunction with the -distribution.
- The general procedure involved is called analysis of variance.
Cem Ozdogan
2012-02-15


![\includegraphics[scale=0.7]{figures/08-22}](img1056.png)
![\includegraphics[scale=0.6]{figures/08-23}](img1057.png)
![\includegraphics[scale=1]{figures/08-24}](img1070.png)
![\includegraphics[scale=1]{figures/08-25}](img1071.png)